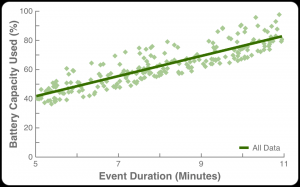
One thing that we have been looking at trying to do for a while is use the data that RCLogbook has collected on everything to try to provide some indication of battery health and how that changes over time. In 3.5, we have added the ability to plot the battery charge amount versus discharge duration for the cycles that we have collected. This gives you something like this:
This is showing synthetic data from one of the “fill the database with records” code (though there is some attempt in that code to make the results look somewhat realistic).
With this, you can start to ask questions like “How long can I fly for?”.
Though the difficulty in reading too much into this comes from a number of factors. First off, RCLogbook does not have a complete picture of what you are doing. That is, it cannot tell the difference between a cycle that was involved in an all-out 3D flight and a cycle that was leisurely touch-and-goes (foreshadowing for 4.0, maybe?). Also, while the linear fit shown is easy to compute and may even be reasonable across a narrow range, batteries are not generally linear things.

